
What Is xG? Expected Goals Explained for Fans
By Eren Şimşir · Published:
Expected goals, or xG, is one of the few soccer statistics that has travelled from analyst spreadsheets to TV graphics so quickly. The idea behind it is simple, though the way it is often quoted (“Team A won the xG 2.4 to 0.6”) hides how it works. This guide explains what xG measures, how it is built, where it misleads and how we use it when we produce a match prediction.
The idea in one example
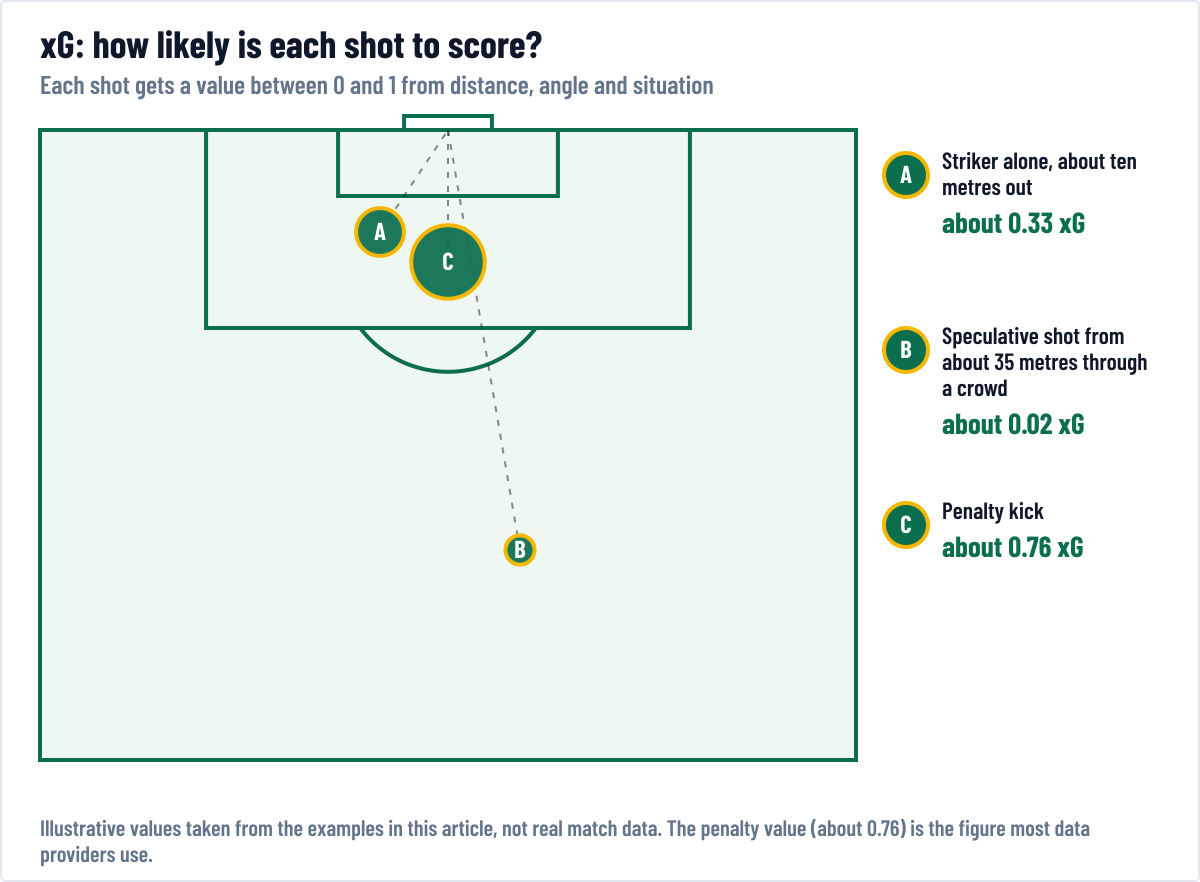
Imagine a striker alone in the penalty area, ten metres out, with only the goalkeeper to beat. Across thousands of similar shots, perhaps one in three has ended in a goal. That shot is therefore worth about 0.33 xG. Now imagine a speculative effort from 35 metres through a crowd of defenders. Very few of those score, so it might be worth 0.02.
Add up the values of every shot a team takes and you get its xG for the match. If a side finishes with 1.8 xG, an average finisher given the same chances would score between one and two goals. That is the number the commentator is quoting.
What goes into the calculation
Different data companies use different models, but nearly all of them start from the same inputs:
- Distance and angle to the goal, the two strongest predictors.
- Body part, since headers convert less often than shots with the foot.
- Type of assist, such as a through ball, cross or set piece.
- Situation, for example open play, counter-attack, corner or penalty.
- Defensive pressure and goalkeeper position in models that use tracking data.
The model is trained on a very large archive of past shots with known outcomes, so each value reflects what has actually happened in comparable situations rather than a guess.
Reading xG correctly
One match is noisy
Because goals are rare, results in a single game are dominated by chance. A team can lose while creating twice as many chances. Treat a single-match xG as a description of the chances created, not as the “deserved” score.
Totals matter more than single shots
The value of xG appears over a season. If a club has scored far more goals than its xG across fifteen or twenty matches, it is either an exceptional finishing side or it has been lucky, and history suggests that luck tends to fade.
Compare xG for and against
A team’s xG difference (chances created minus chances conceded) is often a steadier indicator of quality than its goal difference, because it removes a lot of variation from finishing and goalkeeping.
Related measures you will see
Once you know xG, a few cousins make more sense:
- xGOT (expected goals on target) values a shot after it has been struck, taking account of where it is heading in the goal. It rewards precise finishing and helps assess goalkeepers.
- xA (expected assists) gives credit to the passer for the quality of the chance created, whether or not the shot is converted.
- Non-penalty xG removes spot kicks to show open-play threat.
Each answers a slightly different question, so make sure you know which one a graphic is showing before drawing a conclusion.
A worked match
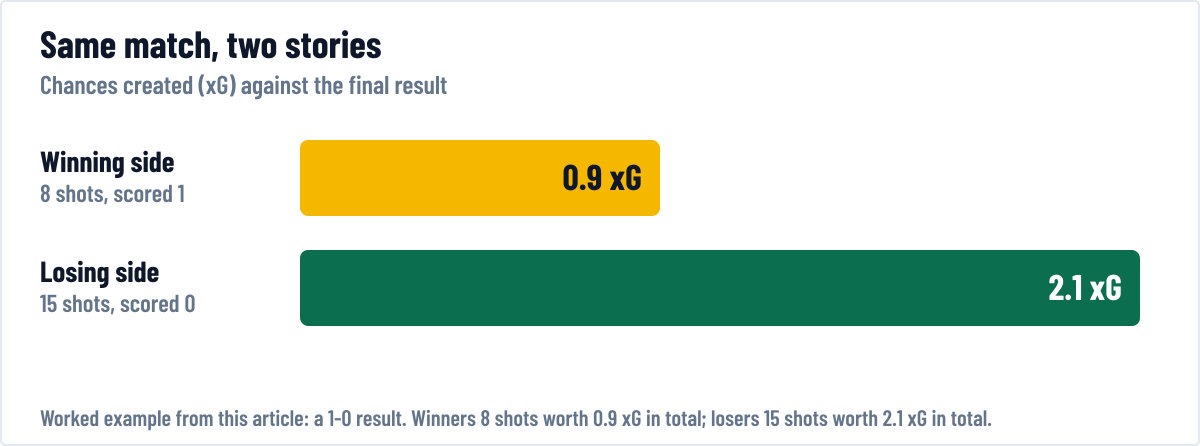
Picture a game that ends 1-0. The winners took eight shots worth a total of 0.9 xG, and the losers took fifteen shots worth 2.1 xG, mostly from range and tight angles. The scoreline says the winners were better. The chance data says the losers created far more danger, but the winners converted their one clear opening. Over a season, the losers’ pattern tends to produce more points than the winners’, and the gap between result and xG is exactly what analysts watch for when they ask which results are likely to repeat.
Common misconceptions
“xG tells you who should have won.” It does not. It tells you how many goals an average finisher would have expected from the chances created. Soccer is not decided by an auditor.
“A player who beats his xG is a great finisher.” Maybe, but it takes a large sample, often several seasons, to tell skill from fortune.
“All xG numbers are the same.” They are not. The same match can show different totals across providers because each model uses different data. Compare numbers from one source only.
How we use xG in predictions
Our model starts from team strength and estimates the expected goals for each side, then converts those figures into scoreline probabilities using a Poisson distribution, as set out on our methodology page. The model itself does not take xG as an input; its expected goals come from team ratings. xG is still a useful sanity check on form: if a team’s results are far ahead of its chance creation, be cautious about expecting them to continue. For a step-by-step routine that puts these numbers to work, see how to predict soccer scores.
A quick checklist before you quote xG
- Is the sample large enough, ideally ten or more matches?
- Are you comparing numbers from the same provider?
- Have you looked at both chances created and chances conceded?
- Are penalties included, and does that change the picture?
- Did the match have a red card or an early goal that changed how it was played?
If you can answer yes to these, xG is one of the most useful tools a fan has for separating good performances from good luck.
Where to learn more
For raw numbers, public pages such as FBref publish team and player expected-goals figures with an explanation of their data provider’s method.
Sources
- Expected goals, Wikipedia, Wikipedia. Definition, how shot values are built and the limits of the metric.
- Maher (1982), “Modelling association football scores”, Statistica Neerlandica. The Poisson basis for converting scoring rates into result probabilities.
- FBref, expected goals model explained, FBref. A data provider’s own description of how its xG values are produced.
Frequently asked questions
What does an xG of 0.5 mean for a single shot?
It means that, historically, shots taken in the same situation have gone in about half the time. Any one shot still either scores or does not.
Is a higher xG always better?
Over many matches, yes: creating more and better chances usually leads to more goals. In a single match, a team can create more xG and still lose.
Does xG include penalties?
Most providers give a penalty a value of roughly 0.76, and some publish figures with and without penalties, called non-penalty xG, to isolate open-play chance creation.
What is a good xG total for one team in a match?
There is no fixed bar. Compare it with the league average, which sits around one and a half goals per team, and judge a side by its average over many games.
Can xG predict the next match?
It is a better guide to future scoring than past goals alone because it strips out luck, but it still needs context such as opponent quality, injuries and venue.